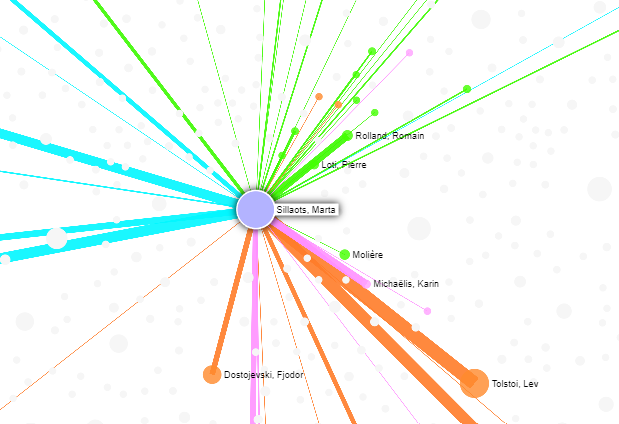
The network of Estonian translations of literature works.
See more
It is more convenient to use the tool on a separate page: https://data.digar.ee/netl/
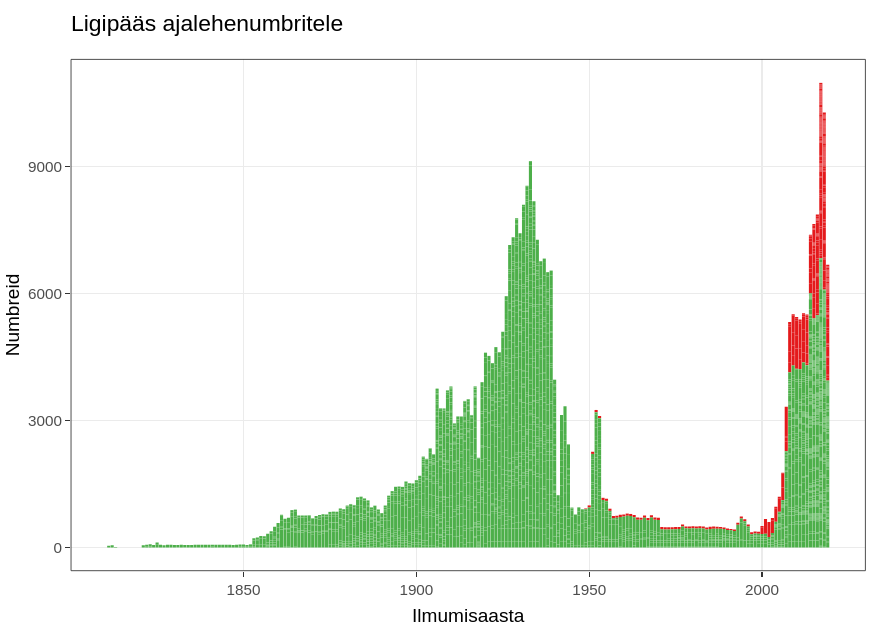
A number of Estonian newspapers have been digitised, but not all. Some of the information about the digitisation is included in the ENB periodicals database. Here we have created a visual tool to get an overview based on that information.
It is more convenient to use the tool on a separate page: https://digilab.shinyapps.io/digitized_newspapers/
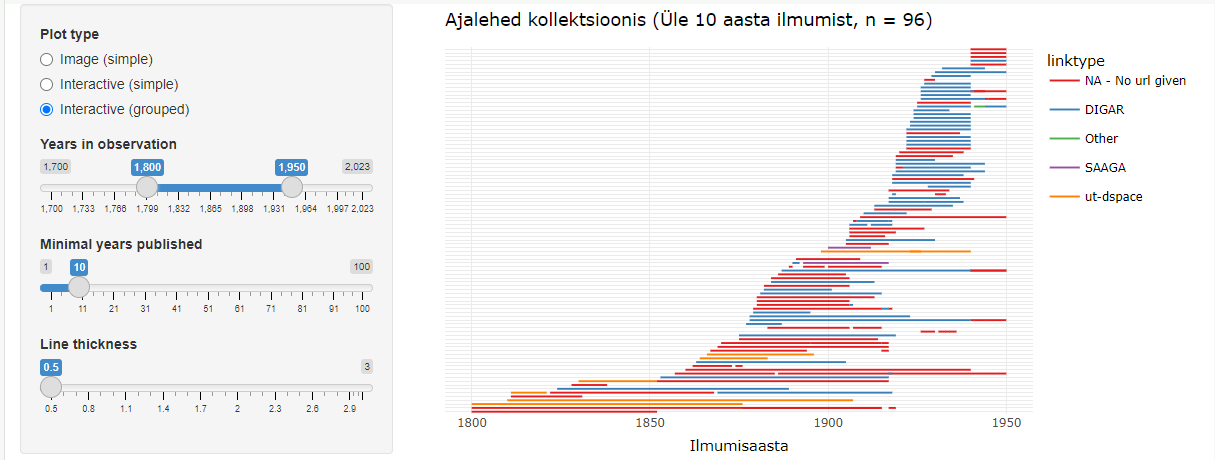
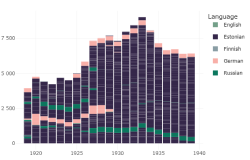
Digitised newspapers in Estonia gives a visual overview of the state of newspaper digitisation in Estonia. The data comes from the periodicals section of the ENB. Not all newspapers digitised in the last few years are yet marked as such.
The visual tool allows the user to select a specific period (which is by default 1800–1950) and from there select the pages that have appeared in at least a certain number of years (the default selection is 10). These parameters can be changed by moving the arrows on the left-hand side of the application.
In addition, it is possible to change the thickness of the line, as the number of newspapers displayed can vary significantly with different parameters. While initially less than 100 newspapers are displayed, displaying all the different editions can draw more than 1200 lines.
The graph shows newspapers in simple or grouped form. The grouped version arranges pages that can be considered as a continuation of the previous ones on a single line.
The graph can be interactive or an image. In an interactive graph, it is possible to get more information about the pages by moving the mouse over the lines. By using the buttons on the top bar of the menu or by selecting an area of the graph, it is possible to take a closer look at some parts of the graph. In addition, it is possible to click on the lines of the digitised newspapers, which will take you to the home page of the digital collection hosting them and to the collection of that newspaper there, if available.
Note
The tool has been supported by the research project EKKD72 "Tekstiainese kasutusvõimalused digihumanitaaria juhtumiuuringutes Eesti ajalehekollektsioonide (1850-2020) näitel".
Data was last updated in April 2023. Data and code can be accessed at OSF https://doi.org/10.17605/OSF.IO/B2HPX.
Folli, an AI-based solution of the National Heritage Board, is designed to automatically describe and systematise visual material in museum collections. One important and time-consuming part of describing images is naming the objects they contain. Folli, on the other hand, can automatically find people, houses, furniture and other objects in photographs. This, in turn, improves search capabilities and allows more detailed analyses of the content of collections.
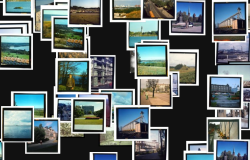
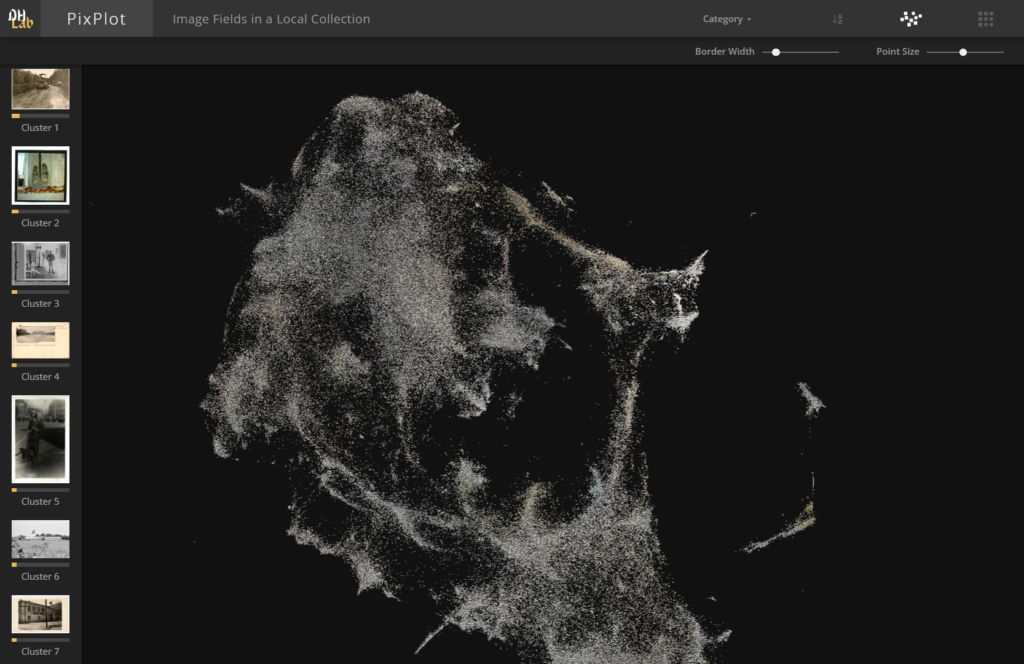
One part of the development of Folli is a demo application that visualises a collection of more than 250 000 photos based on visual similarity. Photos with similar content are placed closer together in the photo cloud, thus forming clusters based on visual themes. For example, in one part of the cloud you might find Soviet-era photos of a birthday party, in another part of the cloud you might find photos of a zeppelin whizzing over Tallinn, and so on.
You can find the demo application here: http://folli.stacc.cloud/demo
(the application may take a few minutes to start)
Folli uses a numeric vector shape to compare images. The images are processed using the InceptionV3 artificial neural network and the UMAP dimensionality reduction algorithm. The demo application's user interface uses PixPlot, a solution developed at Yale University, for the final visualization.
STACC OÜ is behind the technical implementation of the application. The work has been commissioned by the National Heritage Board of Estonia in cooperation with the National Library and the project has been funded by the European Regional Development Fund.
With this Python module, you can download the metadata collections of DIGAR (National Library of Estonia Digital Archives) and ENB (Estonian National Bibliography) by yourself. The module also provides functions to convert them from XML to TSV and JSON formats.
The module, along with the installation and usage guide, can be found here: https://github.com/RaRa-digiLab/metadata-handler
Since the datasets are also available on our datasets page, the module is primarily suitable for automated solutions and other experimentation purposes.
It is more convenient to use the tool on a separate page: https://digilab.shinyapps.io/dea_ngrams/
One way to get an idea of the content of large collections of texts is by looking at the frequency of the words and phrases in them – which words are more or less frequent in different parts of the corpus. For example, Google allows you to search for ngram frequencies over time in its digital collection (see here).
Along the same lines, we've aggregated the content of the DEA newspaper articles by year. These datasets are also downloadable for use on a personal computer.
Unlike Google ngram search, we do not show results for all sources at once. Notably, the content of the collections changes significantly over time and we think that a simple search across all of them may prove rather misleading.
In the demo application, you can search for one-, two- and three-word compounds (1, 2 and 3-grams).
Enter your search term in the text box above. You can choose between corpora of unmodified full texts (gram) and lemmatised texts (lemma). By clicking on the load vocabulary button, the application will load the lexicon of that corpus, which will allow you to display similar words in the lexicon when adding words. It takes a few seconds to load the lexicon.
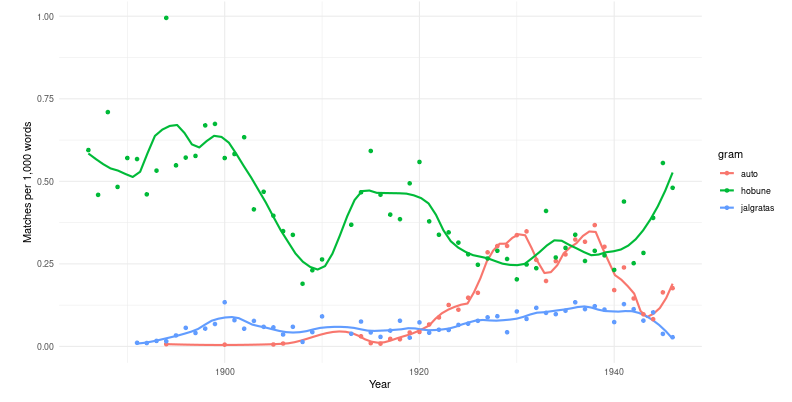
In case of a successful search, you can see a graph on the right. This graph shows the word frequencies over time: the number of times the search term appeared per thousand words.
Currently, the demo application includes texts from the newspaper Postimees from 1880 to 1940.
Making ngrams from digitised material requires a number of simplifying steps. Errors can occur when converting illustrated printed text into machine-readable text: letters may be misplaced within words, words may be broken up into chunks, or random shadows on the paper may be mistaken for words. All of these are called OCR (Optical Character Recognition) errors.
In order to avoid the impact of these errors on the results, all word-like units containing only one letter have been excluded from the analyses.
To simplify the calculations, all words that have occurred fewer than 40 times in the collection and all years when those words occur fewer than 10 times, have been excluded.
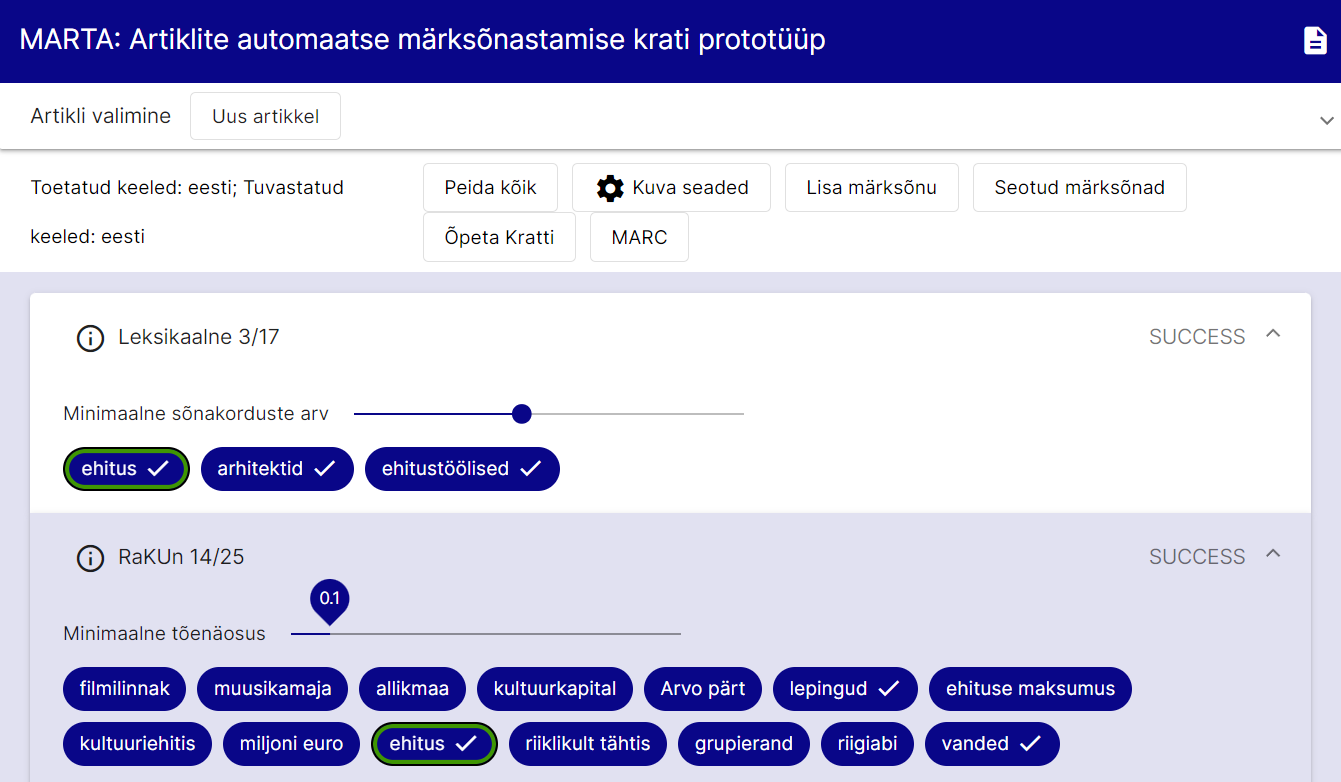
The tool can be found here: https://marta.nlib.ee
MARTA is a prototype for automatic keyword tagging of Estonian articles. The prototype takes text as input (either in plain text format, downloaded from a given URL, or extracted from an uploaded file). Optionally, the user can select applicable methodologies and/or article domains. In the next step, the text is lemmatized and part-of-speech tags are assigned using the MLP10 (multilingual preprocessor) tool from Texta Toolkit. After lemmatization, keyword tagging methods are applied to extract the following keywords from the text:
The detected keywords are compared with the Estonian Thesaurus (EMS). If a keyword also appears in the EMS, a checkmark is displayed next to it. The identified keywords can be exported from the application in MARC format.
You can find a more detailed user guide for the prototype here (in Estonian).
When working with data, it is essential to have a good understanding of your dataset: the sources of the data, how it has been processed, and what aspects can be trusted or not. For specific analyses, it is advisable to structure the dataset in a way that aligns with the research objectives and analytical tools being used.
To facilitate obtaining an overview, digiLab provides the DEA (Digitized Estonian Articles) metadata browser. It is a visual environment for gaining insights into the content of the dataset. The metadata browser operates on extracted metadata from the accessible collection. In the JupyterHub environment, you can access the same metadata with the following command.
all_issues <- get_digar_overview()The application is also accessible in a separate Shiny environment.
In addition to the DEA user interface, there are times when direct access to the texts is needed. For this purpose, Digilab has adopted a separate environment, which allows direct access to the raw texts. It enables working with R code, downloading data, saving analysis results to your computer, and sharing them with others. When using and reusing texts, it is essential to observe the license conditions.
Access to files is supported by the R package digar.txts. With a few simple commands, it allows you to:
1) Get an overview of the dataset with file associations
2) Create subsets of the dataset
3) Perform text searches
4) Extract immediate context from search results
You can also save search results as a table and continue working with a smaller subset of data elsewhere.
Here are the commands:
These commands allow you to explore the collection, obtain specific subsets of data, conduct searches, and extract relevant information for further analysis.
For intermediate processing, various R packages and commands are suitable. For processing in Python, the data should be collected and a new Python notebook should be created beforehand.
suppressPackageStartupMessages(library(tidyverse,lib.loc="/gpfs/space/projects/digar_txt/R/4.3/"))
suppressPackageStartupMessages(library(tidytext,lib.loc="/gpfs/space/projects/digar_txt/R/4.3/"))suppressPackageStartupMessages(library(digar.txts,lib.loc="/gpfs/space/projects/digar_txt/R/4.3/"))all_issues <- get_digar_overview()library(tidyverse)
subset <- all_issues %>%
filter(DocumentType=="NEWSPAPER") %>%
filter(year>1880&year<1940) %>%
filter(keyid=="postimeesew")
subset_meta <- get_subset_meta(subset)
#potentially write to file, for easier access if returning to it
#readr::write_tsv(subset_meta,"subset_meta_postimeesew1.tsv")
#subset_meta <- readr::read_tsv("subset_meta_postimeesew1.tsv")do_subset_search(searchterm="lurich", searchfile="lurich1.txt",subset)texts <- fread("lurich1.txt",header=F)[,.(id=V1,txt=V2)]concs <- get_concordances(searchterm="[Ll]urich",texts=texts,before=30,after=30,txt="txt",id="id")subset2 <- all_issues %>%
filter(DocumentType=="NEWSPAPER") %>%
filter(year>1951&year<2002) %>%
filter(keyid=="stockholmstid")
# The subset2 from stockholstid has 0 issues with section-level data, but 2178 issues with page-level data. In this case pages should be used. When combining sources with page and section sources, custom combinations can be made based on the question at hand. Note that pages data includes also the sections data when available, so using both at the same time can bias the results.
# subset2 %>% filter(sections_exist==T) %>% nrow()
# subset2 %>% filter(pages_exist==T) %>% nrow()
subset_meta2 <- get_subset_meta(subset2, source="pages")
do_subset_search(searchterm="eesti", searchfile="eesti1.txt",subset2, source="pages")Convenience suggestion: to use ctrl-shift-m to make %>% function in the JupyterLab as in RStudio, add this code in Settings -> Advanced Settings Editor… -> Keyboard Shortcuts, on the left in the User Preferences box.
{
    "shortcuts": [
         {
            "command": "notebook:replace-selection",
            "selector": ".jp-Notebook",
            "keys": ["Ctrl Shift M"],
            "args": {"text": '%>% '}
        }
    ]
}
It is more convenient to use the tool on a separate page: https://peetertinits.github.io/reports/nlib/all_works_geo.html
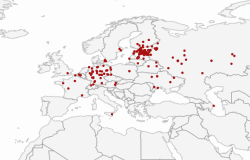
In the metadata of the Estonian National Bibliography, the publication location of most books is recorded. In this tool, a connection has been established between place names and coordinates to provide an overview of the dataset, and the books have been placed on a map based on their place of publication.
The map displays the locations where books were published for each decade and provides information on the number of books published. You can change the displayed time period on the map, zoom in or out, and focus on specific locations. The size of the circle represents the number of books published in that location during the respective years – the larger the circle, the more books were published there.
The points on the map can be clicked to access the corresponding records in Ester, which is a larger database compared to the Estonian National Bibliography. Ester includes not only works directly related to Estonia but also other works that may have some connection to Estonia.
Note: There may be some inaccuracies in marking the geographical locations, primarily due to the existence of multiple places with the same name in the world. These errors are being addressed and corrected.
DIGAR – National Library of Estonia’s digital archive & DEA – DIGAR Estonian Articles
ENB – Estonian National Bibliography
National Library of Estonia
Tõnismägi 2, 10122 Tallinn
+372 630 7100
info@rara.ee
rara.ee/en